Introduction :
“Unlocking the Mystery of Technical Analysis” – Many new traders, non-traders, and even professional fundamental traders misunderstand the role of technical analysis in trading. They often perceive it as a mystical tool that can predict the future of price movements with perfect accuracy. Some become so enamored with this illusion that they end up risking everything on trades they’re overly confident in—leading to account blow-ups. Others dismiss it entirely, viewing technical analysis as little more than superstition and not worth their attention. Both of these perspectives are shortsighted and miss the core truth of technical analysis. No serious technical trader claims to have a crystal-clear vision of market direction based solely on a chart.
In fact, you should be highly skeptical of anyone who does, as it signals a fundamental misunderstanding of the very tools they claim to use.
What Is Technical Analysis?
Technical analysis is the study of price movements. It uses charts to show what has happened in the market, what’s happening now, and what could happen next. Think of it as a way to read the emotions of traders—fear, excitement, hesitation—and spot patterns in how prices behave.
But here’s the key: technical analysis isn’t a crystal ball. It doesn’t tell you exactly where prices will go. Instead, it helps you identify good opportunities to buy or sell while managing your risks.
For example, if you’re flipping a coin and win $2 every time it lands heads but lose $1 on tails, you don’t need to win every flip to make money. Trading works the same way. With technical analysis, you aim to take trades where the potential reward is bigger than the risk, knowing you don’t have to be right every time.
Unfortunately, there are scammers out there who sell expensive courses claiming to teach you the “perfect” way to use technical analysis. They promise you’ll never lose. The truth? Losses are part of trading. But when used correctly, technical analysis can guide you to make better, more informed decisions.
Why Simple Charts Work Best
Have you ever seen a trading chart filled with so many lines and indicators that it’s hard to even see the price? Many new traders do this because they think more tools mean better results. The reality is, less is more when it comes to charts.
Price is the most important part of any chart. Most of the fancy indicators you see are just calculations based on price and time. So, why not focus on the source?
Markets typically move in two ways: they either trend in one direction (up or down) or move sideways in a range. Some indicators work well in trends but fail in ranges, while others do the opposite. That’s why traders say, “All indicators work some of the time, but none work all the time.”
Instead of overloading your chart with tools, keep it clean. Learn to read price movements directly. Often, simple setups are more effective than overly complicated ones.
Chart Expert does not Equate Trade Expert :
Have you ever noticed how many YouTubers, influencers, and chart experts build huge collections of technical indicators and learn about both popular and rare ones, yet they still struggle to turn that knowledge into profits? When it comes to charts, sometimes less is more. This is just my personal opinion, and I apologize if it offends anyone.
Charts can be as simple or as complicated as you make them. Many traders tend to overcomplicate things unnecessarily. If you look at new traders, you’ll often see their charts packed with so many indicators and tools that the actual price chart is barely visible.
As a trader, your main goal is to find low-risk trading setups. Instead of relying on various indicators or tools, you can focus on the price itself. After all, most indicators are ultimately based on time and price.
The market can either move within a range or follow a trend. Some indicators work well in range-bound markets but perform poorly in trending markets. On the other hand, certain indicators are great for trending markets but are terrible for range-bound conditions.
There’s a saying in the markets: “All indicators work some of the time, but none of them work all the time.”
I believe many traders who lose money in trading might actually be great at reading charts. They understand patterns and can analyze them well. However, trading is about much more than just recognizing a head-and-shoulders pattern, a bar chart setup, or a Fibonacci ratio.
I believe the main difference between the top 1% of traders and everyone else is how they think and control their emotions while trading. That doesn’t mean learning to read charts isn’t important. Learning to read charts is also important because it helps you make decisions, but it’s only a small part of what trading is really about.
The growth of gurus selling trading courses shows that a lot of people want to learn how to trade. I think many find a quick weekend course more tempting than spending time reading blogs and books.
The point of technical analysis is to understand price movement in a way that makes sense to you, so you can trade in a way that works for you.
The goal is to turn a blank canvas, like this:
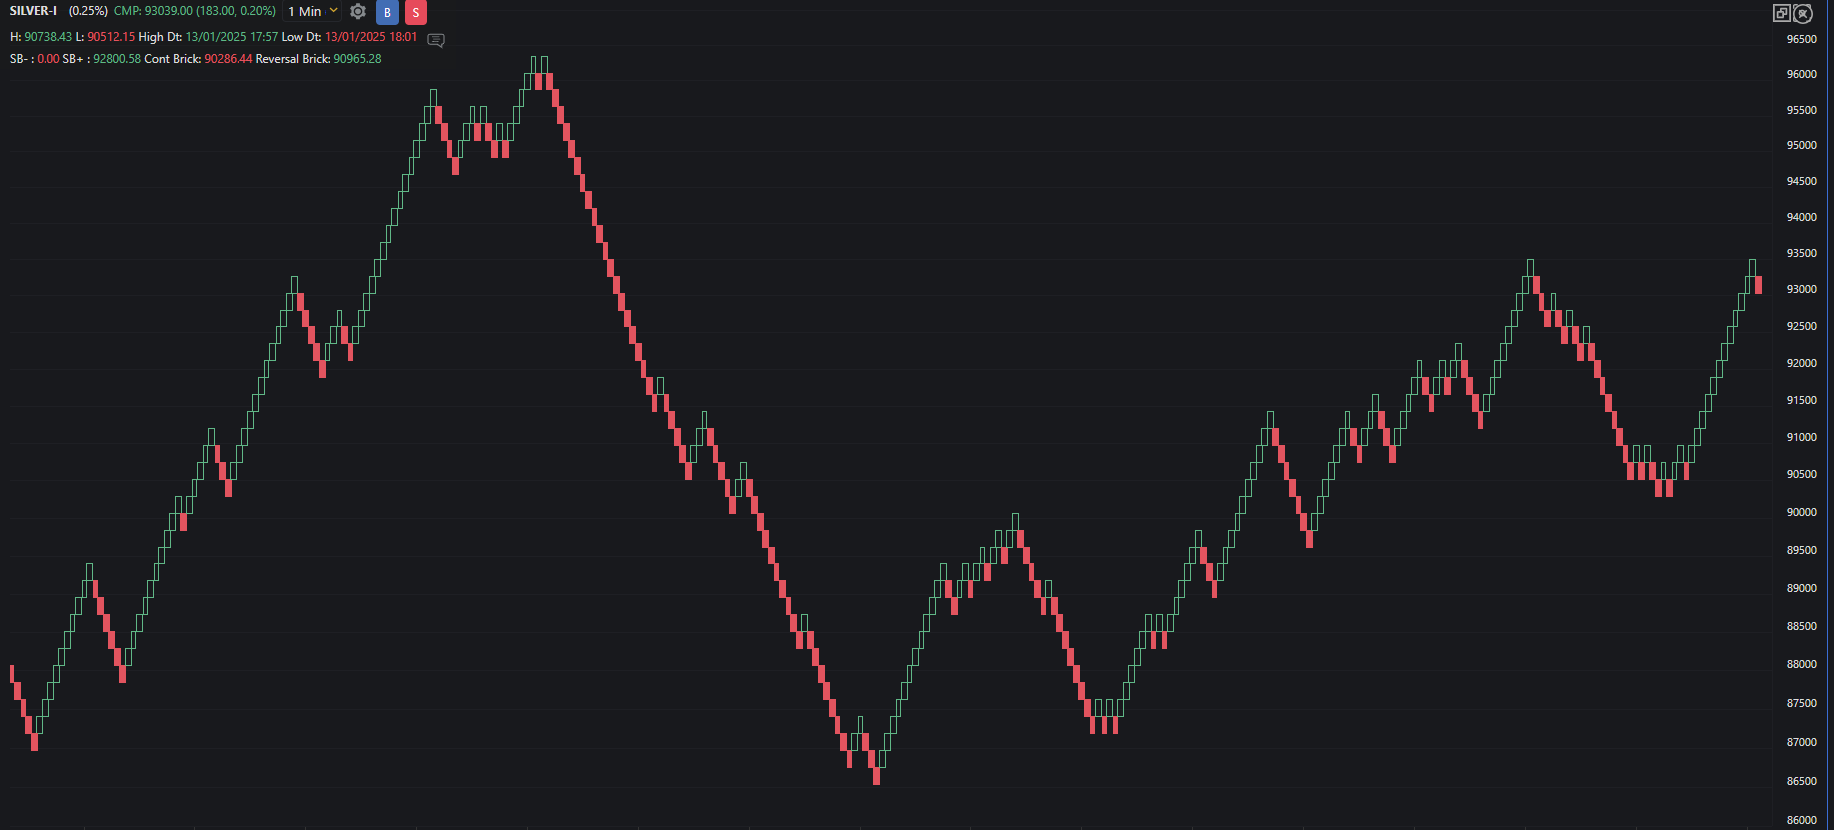
.Into actionable information, like this:
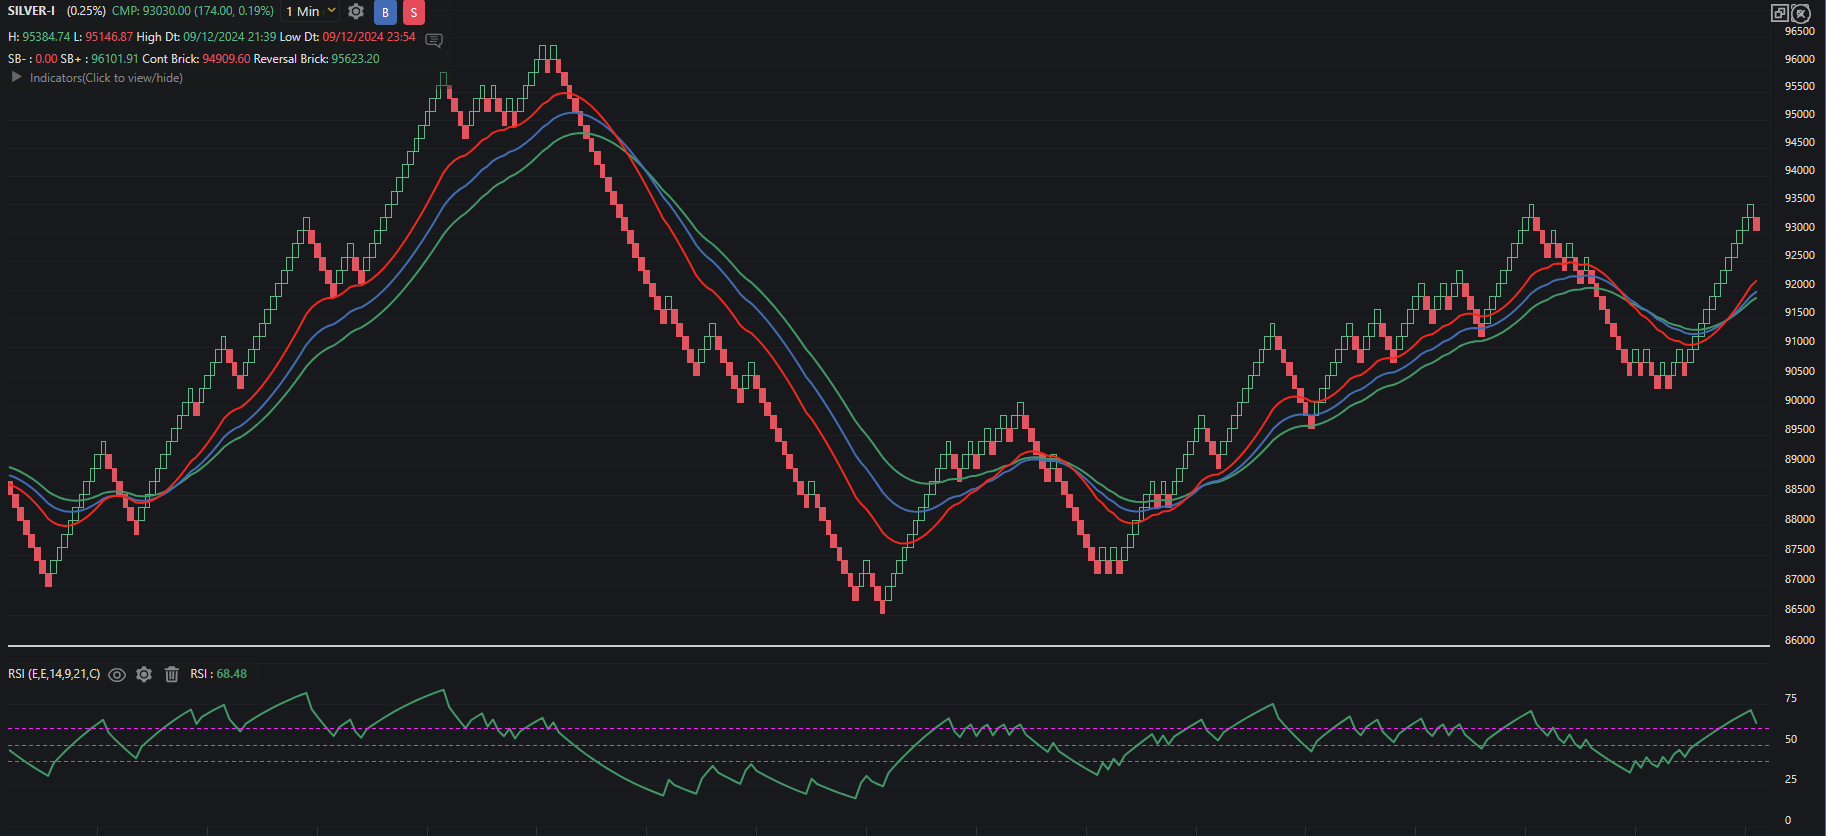 The following trade is a good example of how mindset trumphs technical analysis any day of the week
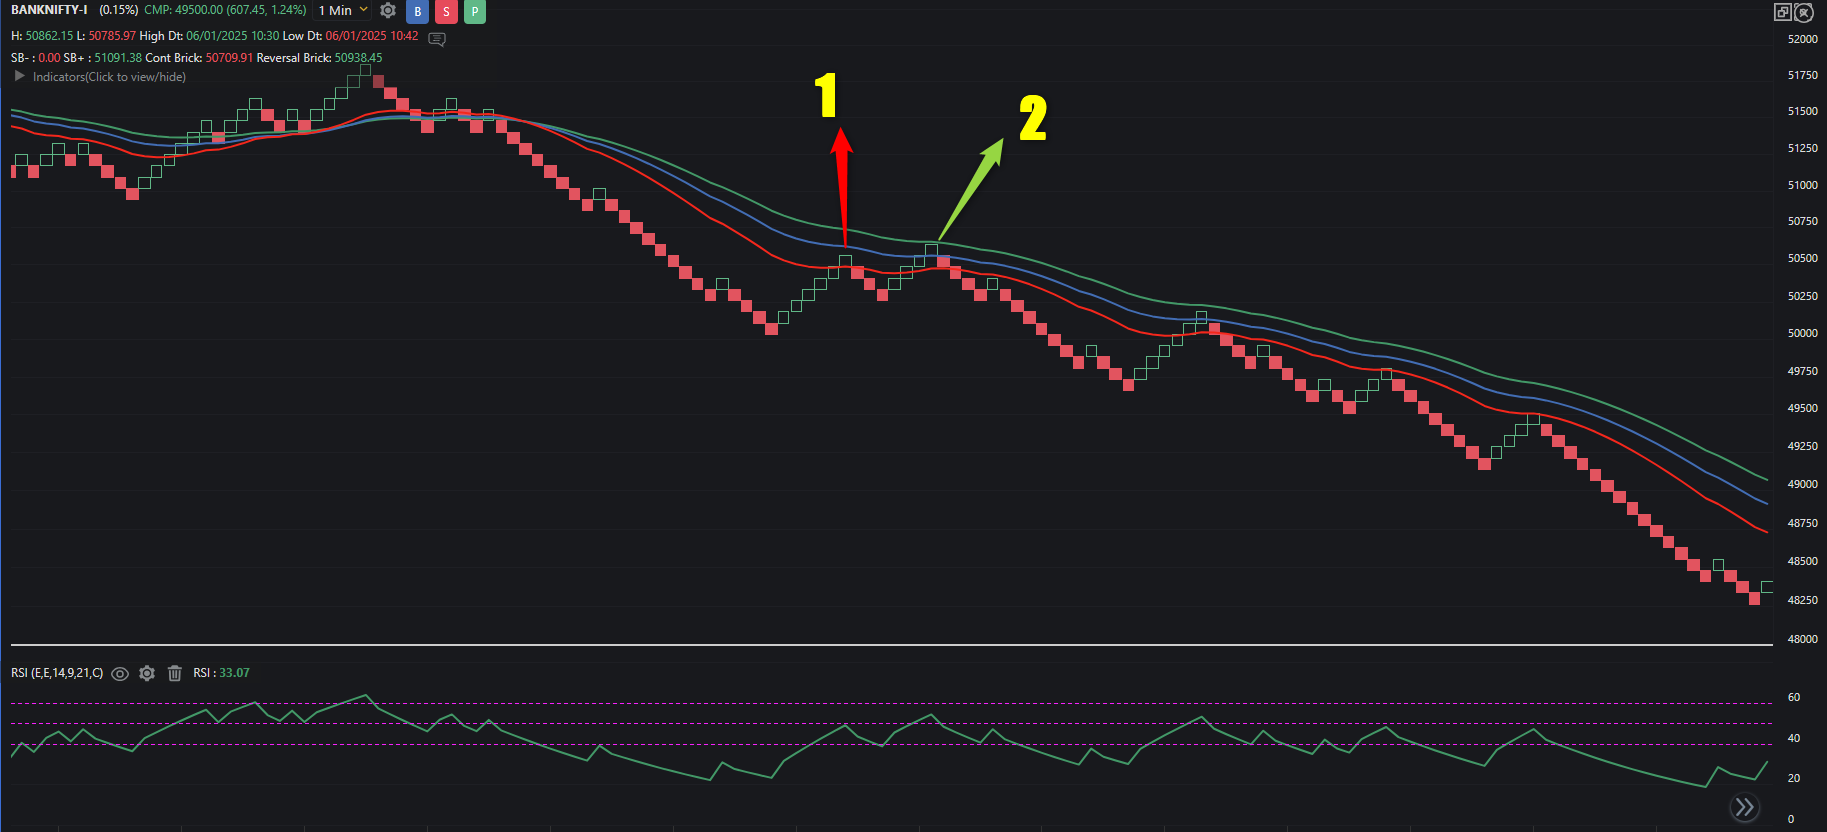
- You can see that I got an entry based on my system. I did my job as a trader—I identified a low-risk entry point and set my stop loss. At this point, I’m at the mercy of the market. Maybe this will turn out to be a great trade, or maybe it won’t—who knows?In this case, the trade hit my stop loss and then went back in my favor. But as a system trader, I accepted the stop loss, reset my mindset, and stayed focused to get back in the zone
- As a price action trader, I understand that stop losses are part of trading because no one can predict the market. I took the trade because it was high probability, and when I saw another setup according to my system, I re-entered. This time, the trade worked out, and I got a big reward.Now imagine if I hadn’t re-entered just because I was upset about the first stop loss—I would’ve missed the winning trade. That’s how the market works.
How to Use Technical Analysis the Right Way
If you’re new to trading, here are some tips to get started with technical analysis:
- Keep It Simple
Don’t clutter your charts with too many indicators. Focus on the basics—price and volume are usually enough to start. - Learn to Read Market Conditions
Understand whether the market is trending (moving up or down) or ranging (moving sideways). Different strategies work for different conditions. - Manage Your Risk
Never risk more money than you’re willing to lose. Before placing a trade, decide how much you can afford to lose if it doesn’t go as planned. - Stay Curious
Read books, watch videos, and learn from experienced traders. The market is always changing, so there’s always something new to learn. - Control Your Emotions
Trading can be exciting and stressful. Don’t let fear or greed drive your decisions. Stick to your plan and stay disciplined.
Conclusion :
Technical analysis is important, but it’s not enough to make you a successful trader on its own. Focus on mastering one charting method, build a Robust trading system around it, and most importantly, work on your mindset. A good psychology routine will help you stick to your process and take trades as planned, even if you face multiple stop losses in a row.
Technical analysis isn’t about predicting the market or finding a guaranteed way to win. It’s a tool—a way to understand price movements and make smarter trading decisions.
The most successful traders don’t just rely on charts. They focus on managing their risks, controlling their emotions, and staying disciplined.
If you’re willing to put in the time and effort, technical analysis can be a valuable part of your trading journey. Remember, it’s not about being perfect or winning every trade. It’s about learning, improving, and staying consistent over the long run.